What is Xdebug?
Many developers, even with extensive experience in PHP, debug their code with the typical PHP functions such as var_dump(), print_r() or simple echo statements, to dump the content of the variables. Although this method sometimes can get you out of trouble, often falls short. Here is when you should use Xdebug. In this article I will show you how to add it to your local environment step by step.
Xdebug is a PHP extension to debug from the IDE with traditional debugging tools. We can find this extension on their website: https://xdebug.org. Xdebug will allow you not only to analyze the content of the variables, but also to monitor the flow of execution, therefore you will know what is really happening.
Adding Xdebug to your Dockerfile
A Dockerfile is a text document that contains all the commands that we need to execute on the command line to assemble a Docker image.
By adding the code below to the end of our PHP Dockerfile, we install the Xdebug extension to the Docker container when we run it up.
RUN yes | pecl install xdebug \
    && echo "zend_extension=$(find $(php-config --extension-dir) -name xdebug.so)" \
    > /usr/local/etc/php/conf.d/xdebug.ini
Note: that you will have the error ERROR: `phpize’ failed if you don’t add $PHPIZE_DEPS dependency.
Make sure you have this line on your Dockerfile:
RUN apk add --no-cache \
    $PHPIZE_DEPS
Create an override docker-compose for your local environment
We can use multiple docker-compose.yml files to customize a Docker Compose application for different environments or different workflows. In this case we need to modify the php service of our local environment to configure Xdebug.
By default, Docker Compose reads two files, a docker-compose.yml and an optional docker-compose.override.yml file. The file docker-compose.yml contains our base configuration, and we should have this file in our repository, and the docker-compose.override.yml file contains configuration overrided, this one will not be on our repository, only in our local environment.
services:
  my_php_service:
    environment:
      - XDEBUG_CONFIG='mode=debug client_host=host.docker.internal idekey=phpstorm-xdebug start_with_request=trigger remote_handler=dbgp client_port=9003'
As we can observe in the above code, we create our docker-compose.override.yml file, and add the environment variables for our Xdebug configuration:
- mode=debug Enables Step Debugging. This can be used to step through your code while it is running, and analyse values of variables
- client_host=host.docker.internal IP or hostname where Xdebug will attempt to connect to. In this case, host for docker in Windows and MacOS, if you are using Linux you may need to put 172.17.0.1 instead of host.docker.internal
- idekey=phpstorm-xdebug Controls which IDE Key Xdebug should pass on to the debugging client.
- start_with_request=trigger The functionality only gets activated when a specific trigger is present when the request starts.
- remote_handler=dbgp
- client_port=9003 The port to which Xdebug tries to connect on the remote host.
Configure Xdebug in PhpStorm
The final step is to configure Xdebug in our IDE. It is very similar for any IDE with debug features, for this example, we are going to use the most common IDE for PHP developers, PhpStorm.
First of all, we need to configure the server on PhpStorm. To do that, we have to go to:
Languages and Frameworks > PHP > ServersAnd add a new server using + icon, and configure like on the screenshot below:
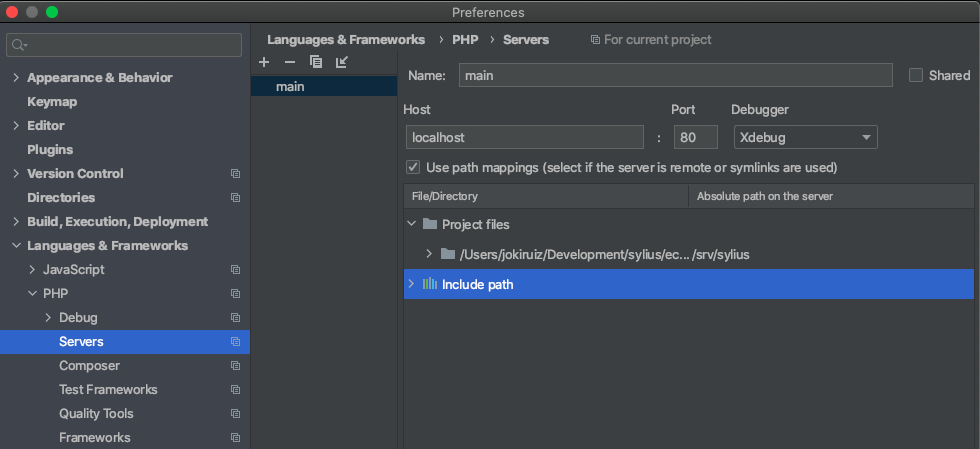
Make sure to check «Use path mappings» and map the project folder to the server root path, for example «/var/www/myapp», «/srv/myapp», etc.
Next, we need to configure PHP remote debugger in PhpStorm:
Run > Edit configurations > PHP Remote DebugAdd a new configuration with the next values:
- Activate «filter debug connection by IDE key» option.
- Specify the Server to the server just created on the previous step, in this case «main».
- And for the IDE key, set it to PHPSTORM
Once you have done that, you can select our debug configuration in PhpStorm debug panel.
And that’s it! Go to your project root folder and execute:
docker-compose up -dYou can now set a breakpoint, and start listening for connections in PhpStorm debug panel.